Research Question- How is the position of the cart on the ramp affected by time?
Independent variable- Time
Dependent variable- Position
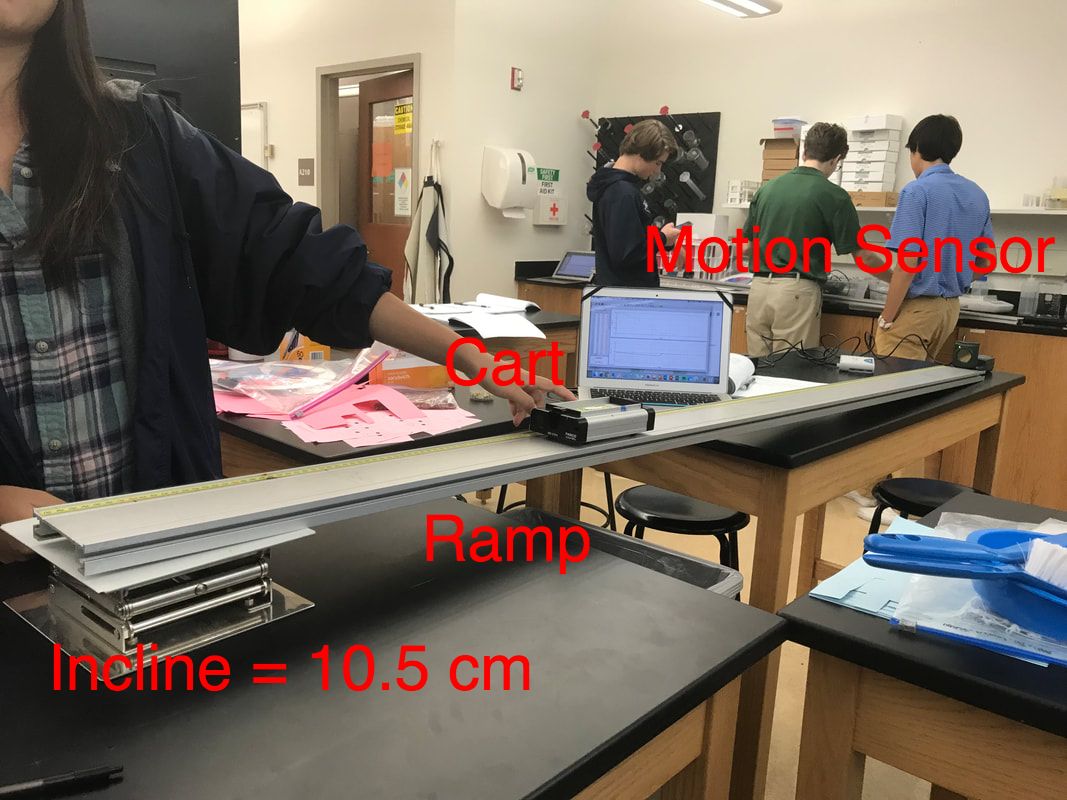
Controls- Cart we used, incline of the ramp (10.5 cm at the tallest point), surface of the ramp
We used the same cart throughout the lab and left the ramp balanced on the same object so the surface and incline didn't change.
Procedure for Motion Sensor
Procedure for Video Analysis
Independent variable- Time
Dependent variable- Position
Controls- Cart we used, incline of the ramp (10.5 cm at the tallest point), surface of the ramp
We used the same cart throughout the lab and left the ramp balanced on the same object so the surface and incline didn't change.
Procedure for Motion Sensor
- Connect the motion sensor to LoggerPro on a computer
- Place the motion sensor at the end of the track
- Let the cart run for a short period of time and then start the motion sensor (Initial position = 211 cm but this will be off a little bit because we had to let the cart move before we started the motion sensor)
- Let the cart roll down the ramp and stop it just before it hits the motion sensor
- Stop data collection and analyze position vs. time graph (Final position = 3 cm) and a velocity vs. time graph
Procedure for Video Analysis
- Set up the camera so it can see the cart and the entire track which measures 2.275m
- Make sure the camera will stay still throughout the video
- Start the cart and let it travel from left to right
- Import the video to LoggerPro and run a video analysis to create a position vs. time graph and a velocity vs. time graph
Since both the Motion Sensor and the Video Analysis data goes directly into LoggerPro, there is no recorded raw data for this lab.
Motion Sensor Graphs
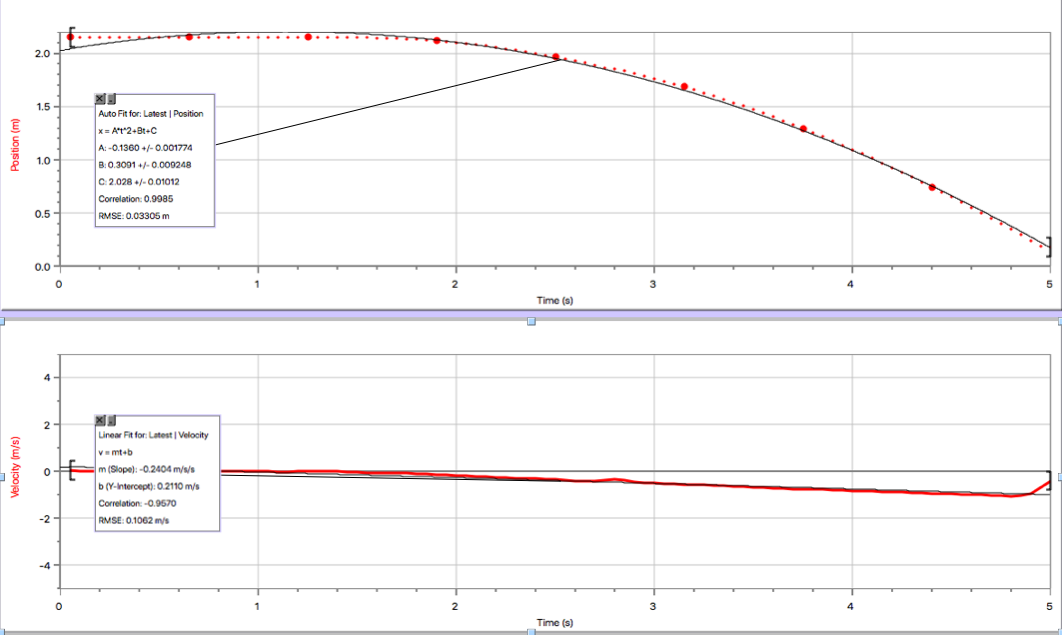
Position vs. Time Graph
Velocity vs. Time Graph
- Position = -0.1360 m/s^2 * Time^2 + 0.3091 m/s * Time + 2.028 m
- Slope- As time increases, the cart's position decreases (going towards the motion sensor) and it is speeding up (slope is getting steeper)
- Y-intercept- Cart is 2.028 m away from the motion sensor at time = 0 s. This makes sense because the cart started at 211 cm or 2.11 m but we had to start the motion sensor a little bit after the cart had started moving, so the initial position is a little closer to the motion sensor
Velocity vs. Time Graph
- Velocity = -0.2404 m/s^2 * Time + 0.2110 m/s
- Slope- As time increases by 1 second, velocity decreases by 0.2404 m/s^2, so the cart has a uniform acceleration of -0.2404 m/s^2
- Y-intercept - Initial velocity was 0.2110. This doesn't make sense because the cart was always traveling in the negative direction, so it should have been a slightly negative y-intercept (because we didn't start the motion sensor when the cart was at rest)
Video Analysis Graphs
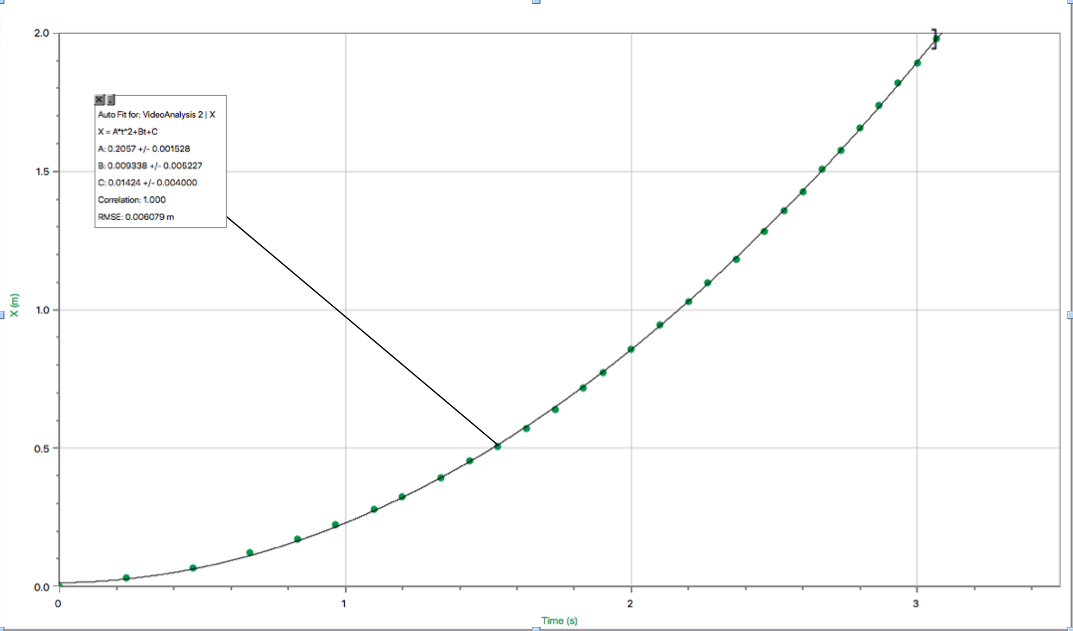
Position vs. Time Graph
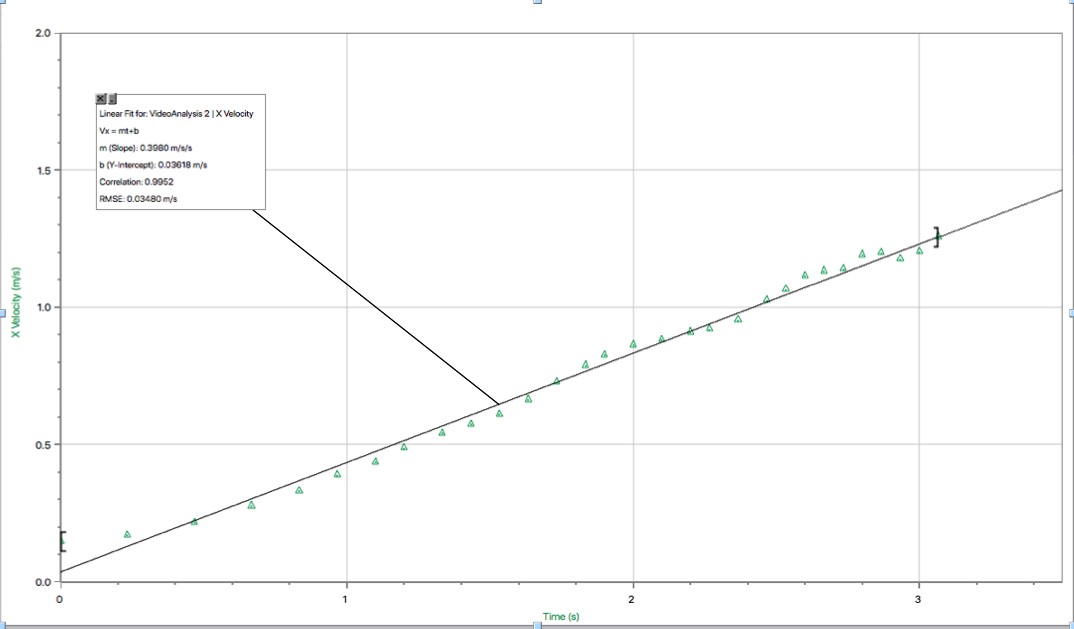
Velocity vs. Time Graph
Conclusion- This lab was an extension on the buggy lab because we moved from the buggy traveling on a flat surface at a constant velocity to a cart moving down the ramp. Instead of moving at a constant velocity, the data from both the motion sensor and the video analysis shows that the cart was accelerating. The position vs. time graphs both are getting steeper, so the cart is speeding up. The only difference is the direction because the cart was moving towards the motion sensor (negative direction) while the video analysis just had the cart moving to the right (positive direction). The velocity time graphs for both have a linear relationship, which means that the cart had a uniform acceleration. Direction once again changes the sign of the slopes, but the magnitudes are relatively similar at 0.2440 m/s^2 and 0.3980 m/s^2 and since both velocity graphs are going away from 0 m/s, the cart was speeding up in both scenarios. Although the magnitudes weren't as close to each other as they were in the buggy lab, this lab proved once again that the method of measurement doesn't matter because it is more important to take accurate measurements of position and time. I knew going into this experiment that the cart would accelerate, and since our data confirmed this we can apply it to real world situations to know that going down a hill or a ramp is going to cause acceleration.
Evaluating Procedures- On source of uncertainty that always exists with the video analysis is the conversion from pixels to meters. This process has a level of uncertainty associated with it because I provided the conversion that the length of the track was 2.275 m, but it can't be converted perfectly, and this can really affect the measurements. Another source of uncertainty is reaction time because we had to stop the cart before it ran into the motion sensor, but this means that we may have taken a few extra data points that were affected by one of our hands stopping the cart. It was impossible to stop the data collection at the exact instant that we stopped the cart, and these extra points could have affected the linear and quadratic regressions we found.
Improving the Investigation- I think using a longer and taller ramp would improve the investigation because we could collect more data points. Since it only took the cart about 3-5 seconds to go down our ramp, and since we had to start the motion sensor a little bit later so the cart was already moving, there was a very small range of possible data points. If we used a ramp that was 3 times taller and longer, this would cause the reaction time to have a smaller effect overall on the data. The cart would have been traveling for much longer on its own, so this also would create a better picture of its uniform acceleration.
- Position = 0.2057 m/s^2 * Time^2 + 0.009338 m/s * Time + 0.01424 m
- Slope- As time increases, the cart's position increases (going to the right is the positive direction) and it is speeding up (slope is getting steeper)
- Y-intercept- The cart's initial position is 0.01424 m or 1.424 cm. This should have been 0 m because while I did the video analysis, I made the first point the origin so both the time and the position should have been 0.
Velocity vs. Time Graph
- Velocity = 0.3980 m/s^2 * Time + 0.03618 m/s
- Slope- As time increases by 1 second, velocity increases by 0.3980 m/s^2, so the cart has a uniform acceleration of 0.3980 m/s^2
- Y-intercept - Initial velocity was 0.03618. This is very close to 0 which it should of been because the first point that I selected was just before the cart began to move.
Conclusion- This lab was an extension on the buggy lab because we moved from the buggy traveling on a flat surface at a constant velocity to a cart moving down the ramp. Instead of moving at a constant velocity, the data from both the motion sensor and the video analysis shows that the cart was accelerating. The position vs. time graphs both are getting steeper, so the cart is speeding up. The only difference is the direction because the cart was moving towards the motion sensor (negative direction) while the video analysis just had the cart moving to the right (positive direction). The velocity time graphs for both have a linear relationship, which means that the cart had a uniform acceleration. Direction once again changes the sign of the slopes, but the magnitudes are relatively similar at 0.2440 m/s^2 and 0.3980 m/s^2 and since both velocity graphs are going away from 0 m/s, the cart was speeding up in both scenarios. Although the magnitudes weren't as close to each other as they were in the buggy lab, this lab proved once again that the method of measurement doesn't matter because it is more important to take accurate measurements of position and time. I knew going into this experiment that the cart would accelerate, and since our data confirmed this we can apply it to real world situations to know that going down a hill or a ramp is going to cause acceleration.
Evaluating Procedures- On source of uncertainty that always exists with the video analysis is the conversion from pixels to meters. This process has a level of uncertainty associated with it because I provided the conversion that the length of the track was 2.275 m, but it can't be converted perfectly, and this can really affect the measurements. Another source of uncertainty is reaction time because we had to stop the cart before it ran into the motion sensor, but this means that we may have taken a few extra data points that were affected by one of our hands stopping the cart. It was impossible to stop the data collection at the exact instant that we stopped the cart, and these extra points could have affected the linear and quadratic regressions we found.
Improving the Investigation- I think using a longer and taller ramp would improve the investigation because we could collect more data points. Since it only took the cart about 3-5 seconds to go down our ramp, and since we had to start the motion sensor a little bit later so the cart was already moving, there was a very small range of possible data points. If we used a ramp that was 3 times taller and longer, this would cause the reaction time to have a smaller effect overall on the data. The cart would have been traveling for much longer on its own, so this also would create a better picture of its uniform acceleration.
