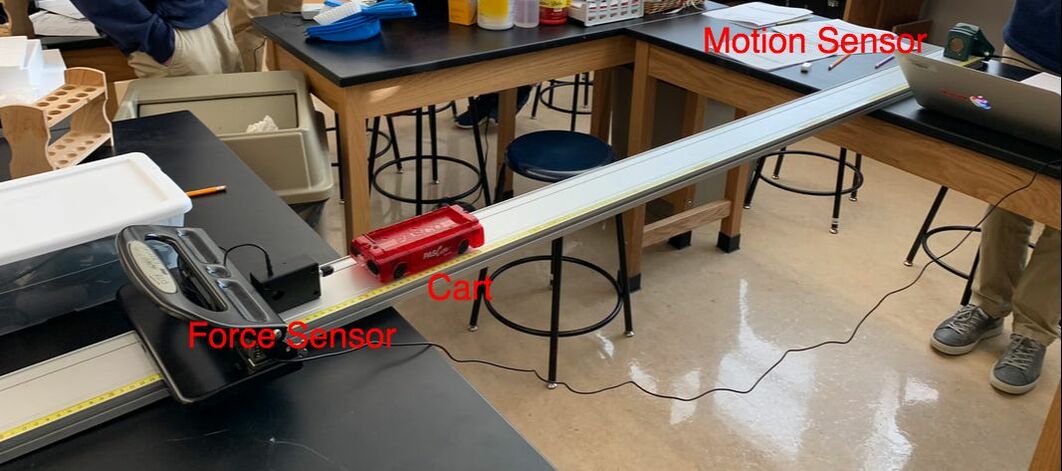
Setup of the Experiment- Push the cart away from the motion sensor and towards the force sensor, and then let it bounce off of the force sensor
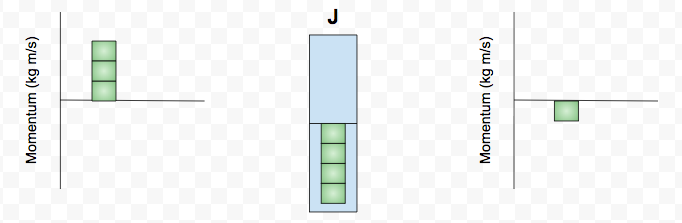
Momentum Bar Chart
- Initial Momentum is positive (moving away from the motion sensor)
- Force sensor has negative impulse so then the cart changes direction, but it is traveling slower than it was before
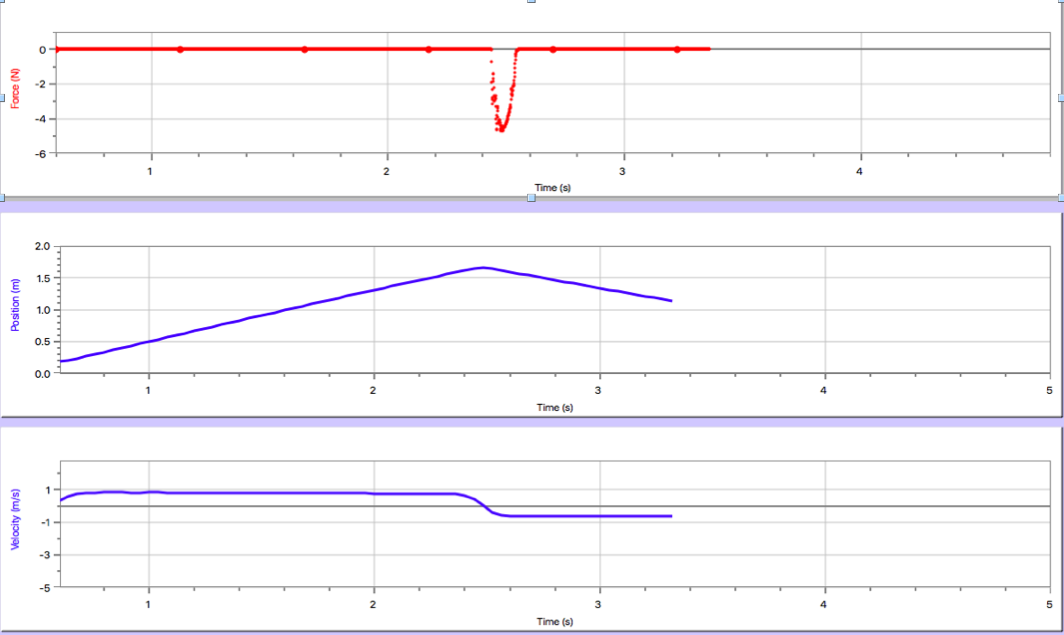
Graphs
|
|
Red Line = Velocity vs. Time graph Purple Line = Momentum vs. Time graph (multiplied by .252) Link to the graph |
Calculations
Initial Momentum = Initial Velocity * Mass = 0.8 m/s * 0.252 kg = 0.2016 kgm/s
Final Momentum = Final Velocity * Mass = -0.6 m/s * 0.252 kg = -0.1512 kgm/s
Impulse (change in momentum) = -0.1512 - 0.2016 = -0.3528 kgm/s
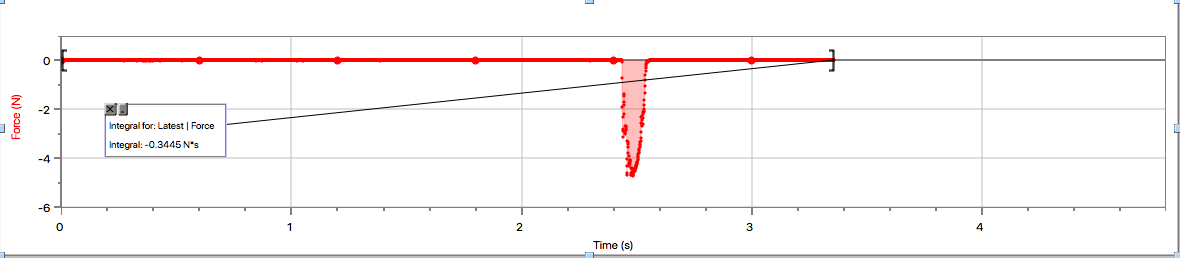
Impulse from Force vs. Time graph = Area under the graph = -0.3445 kgm/s
Percent Difference = |-0.3445+.3528|/.3528 = 2.35%
Final Momentum = Final Velocity * Mass = -0.6 m/s * 0.252 kg = -0.1512 kgm/s
Impulse (change in momentum) = -0.1512 - 0.2016 = -0.3528 kgm/s
Impulse from Force vs. Time graph = Area under the graph = -0.3445 kgm/s
Percent Difference = |-0.3445+.3528|/.3528 = 2.35%
Conclusion
The goal of the impulse experiment was to prove the equations we learned in class. We learned that impulse is the same as the change in momentum and impulse is also the area under a force vs. time graph, and based on our data, we proved these ideas. Our group set up a cart on a track and gave it a push, so it would move away from a motion sensor and towards a force sensor, hit the force sensor, and then change direction and travel back towards the motion sensor. We then analyzed the force vs. time, position vs. time, and velocity vs. time graphs. Looking at the velocity vs. time graph, we determined that the initial velocity was about 0.8 m/s and the final velocity was -0.6 m/s. The mass of the cart was 0.252 kg, so this gave us what we needed to calculate the initial and final momentums, and therefore the impulse. We also used LoggerPro to find the area under the Force vs. time graph because this is another way to find impulse. Comparing these two values (-0.3528 and -0.3445) gives us a 2.35% difference. Since this percent difference is very small, we can conclude that our data effectively proves what we have learned about impulse.
One source of uncertainty is the precision of our velocity measurements. We looked at the velocity vs. time graphs and approximated the initial and final velocities, but it is difficult to read the graph, especially because LoggerPro only rounds to hundredths. This only would have affected the impulse measurement that we found through calculating momentum, so it could account for some of the 2.35% difference. Another source of uncertainty is that we disregarded the force of friction; some of the energy is converted into heat through friction, so the cart slows down a little bit and this would affect our data.
One source of uncertainty is the precision of our velocity measurements. We looked at the velocity vs. time graphs and approximated the initial and final velocities, but it is difficult to read the graph, especially because LoggerPro only rounds to hundredths. This only would have affected the impulse measurement that we found through calculating momentum, so it could account for some of the 2.35% difference. Another source of uncertainty is that we disregarded the force of friction; some of the energy is converted into heat through friction, so the cart slows down a little bit and this would affect our data.
| Impulse and Momentum Notes.pdf |
Widget is loading comments...
