Experiment 1 - Net Force and Acceleration
Research Question- What effect does changing the net force on a system have on the acceleration of the system?
Independent Variable- Net force acting on the system
Dependent Variable- Acceleration
Controls- Total mass of the system
Method for controls- Since both the cart and the hangar are part of the system, we will keep the total mass of the system constant by taking mass from the cart and adding it to the hangar (moving mass instead of adding mass)
Procedure
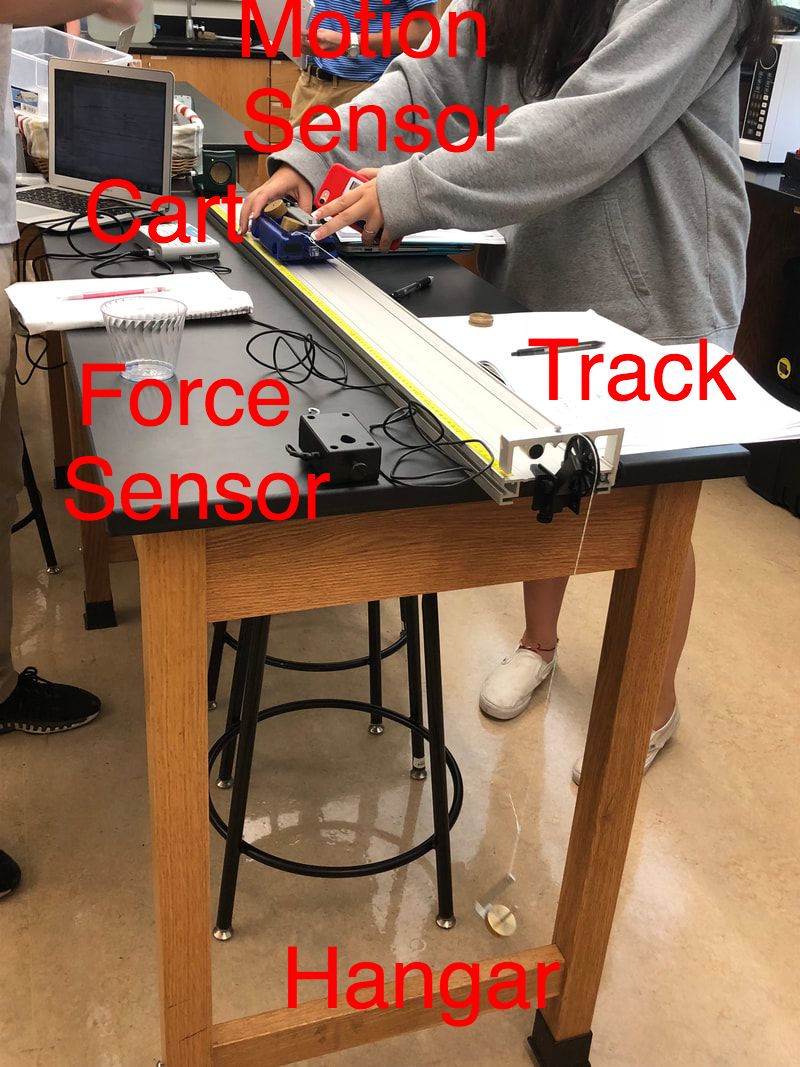
- Measure the mass of our system (cart, string hanger, all of the hanging masses, etc.)
- Connect a motion sensor to LoggerPro to collect motion data (Position-Time and Velocity-Time graph)
- Record total mass of the hanger (or net force) and release the cart from rest while the motion sensor is collecting data.
- Record the acceleration by calculating the slope of the resulting Velocity vs. Time Graph
- Repeat steps 3 and 4 for 10 different hanging masses.
Net Force of the Hangar (N) |
Acceleration (m/s/s) |
0.383 |
0.1671 ± 0.15 |
0.561 |
0.3726 ± 0.15 |
0.671 |
0.5013 ± 0.15 |
0.767 |
0.7023 ± 0.15 |
0.863 |
0.7478 ± 0.15 |
1.054 |
1.289 ± 0.15 |
1.156 |
1.353 ± 0.15 |
1.337 |
1.44 ± 0.15 |
1.54 |
1.598 ± 0.15 |
1.6 |
1.807 ± 0.15 |
I chose an uncertainty value of 0.15 m/s/s for the acceleration because there is some uncertainty with our velocity measurements.
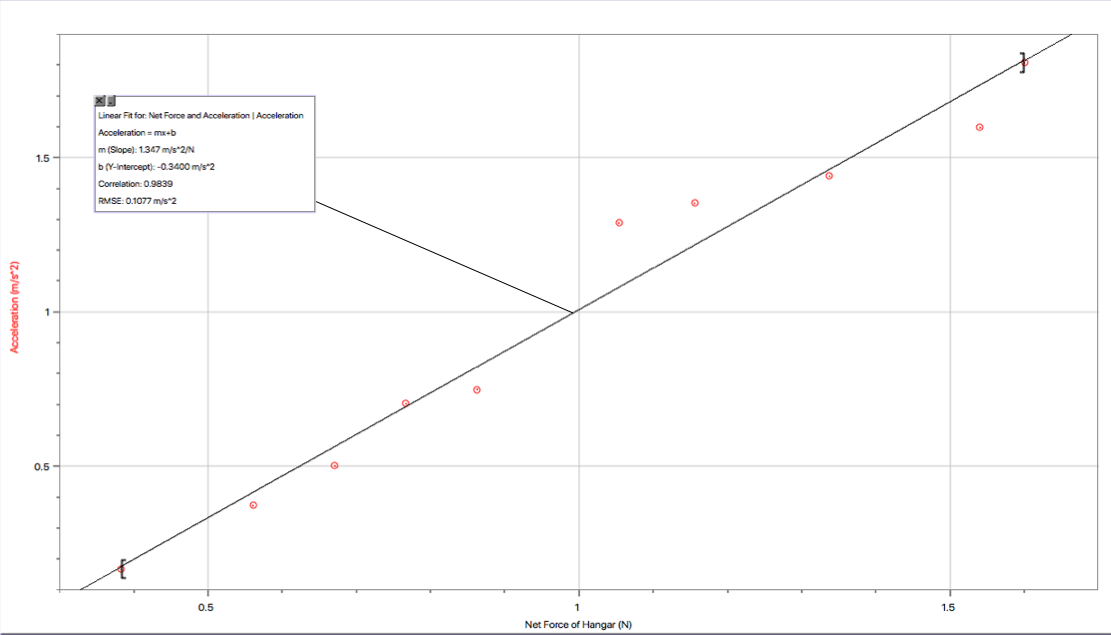
Acceleration = 1.347 (m/s^2)/(N) - 0. 3400 m/s^2
Slope = As the Net Force increases by 1 N, the Acceleration increases by 1.347 m/s^2
Y-intercept = Acceleration when the Net Force is 0 is -0.3400
Should have been 0 because no Net Force means a constant velocity or an acceleration of 0
Slope = As the Net Force increases by 1 N, the Acceleration increases by 1.347 m/s^2
Y-intercept = Acceleration when the Net Force is 0 is -0.3400
Should have been 0 because no Net Force means a constant velocity or an acceleration of 0
Experiment 2 - Mass and Acceleration
Research Question- What effect does changing the total mass on a system have on the acceleration of the system?
Independent Variable- Total mass of the system
Dependent Variable- Acceleration
Controls- Net force of the system
Method for controls- Since the net force is based on the amount of mass added to the hanger, we will not change this mass and instead we will add mass directly to the cart.
Procedure
Independent Variable- Total mass of the system
Dependent Variable- Acceleration
Controls- Net force of the system
Method for controls- Since the net force is based on the amount of mass added to the hanger, we will not change this mass and instead we will add mass directly to the cart.
Procedure
- Measure the mass on the hanger (or Net Force)
- Connect a motion sensor to LoggerPro to collect motion data (Position-Time and Velocity-Time graph)
- Record total mass of the system and release the cart from rest while the motion sensor is collecting data.
- Record the acceleration by calculating the slope of the resulting Velocity vs. Time Graph
- Repeat steps 3 and 4 for 9 different system masses.
Mass of the System (kg) |
Acceleration (m/s/s) |
0.272 |
1.47 ± 0.15 |
0.292 |
1.42 ± 0.15 |
0.312 |
1.308 ± 0.15 |
0.352 |
1.134 ± 0.15 |
0.372 |
1.127 ± 0.15 |
0.452 |
0.936 ± 0.15 |
0.502 |
0.825 ± 0.15 |
0.602 |
0.69 ± 0.15 |
0.702 |
0.576 ± 0.15 |
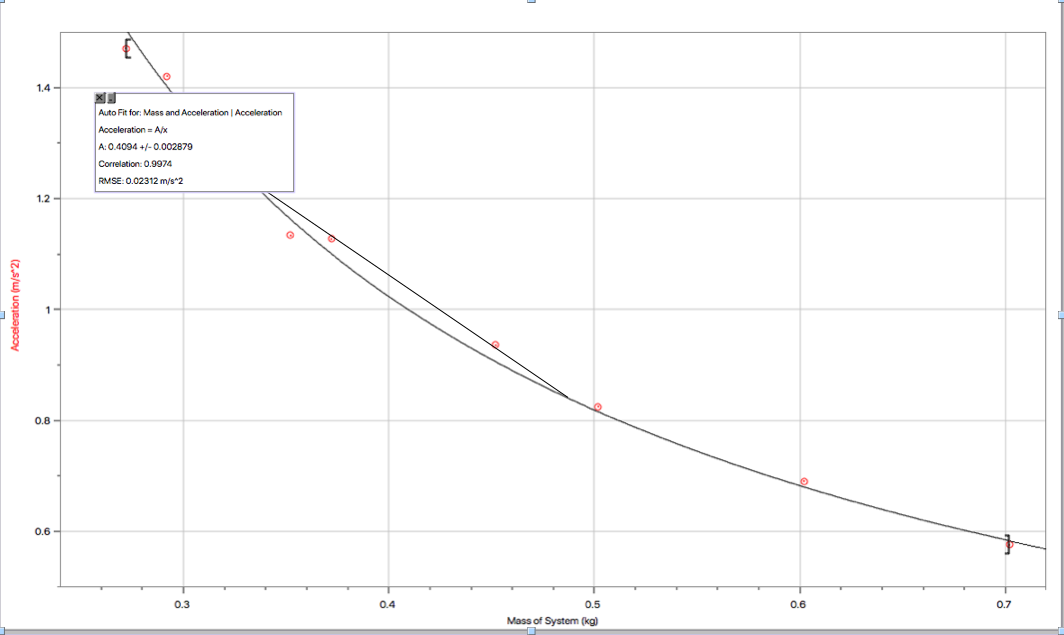
Acceleration = [0.4094 (kg)(m/s^2)] / mass
Slope= As the Mass of the System increases, the Acceleration decreases but by less and less
No y-intercept because a system with a mass of 0 kg isn't possible
No negative y-values because the cart doesn't turn around after a certain amount of mass
Slope= As the Mass of the System increases, the Acceleration decreases but by less and less
No y-intercept because a system with a mass of 0 kg isn't possible
No negative y-values because the cart doesn't turn around after a certain amount of mass
Conclusion- These experiments help to prove Newton's Second Law. For the Net Force and Acceleration experiment, I found a linear relationship with a slope of 1.347 (m/s^2)/(N) and a y-intercept of -0. 3400 m/s^2. This should have been a y-intercept of 0 because I have learned that Net Force and Acceleration are directly proportional and a Net Force of zero means that the acceleration is 0 m/s^2 (Newton's First Law). However, the data our group collected still reveals that Net Force and Acceleration have a linear relationship, we just didn't find that it was directly proportional. For the Mass and Acceleration experiment, I found an inverse relationship which shows that Mass and Acceleration are inversely proportional (as Mass increases by a certain amount, Acceleration decreases by the same amount). Therefore, the data we found makes sense according to Newton's Second Law. Since I have proved the validity of the law myself, this is going to help me gain a better understanding of the law for the rest of the class.
Evaluating Procedures- One source of uncertainty that was present in both experiments is reaction time. Since the ramp wasn't very long and we couldn't let the cart crash at the end, we had to stop the cart shortly after it started. This meant that the slopes of our velocity vs. time graph (acceleration) were based off of a very small set of data, which means that they are not as precise as they could be. Another source of uncertainty was selecting the unaffected values from the velocity time graphs. We looked to choose the values that showed a clear slope because those were the times when we weren't stopping the cart or anything, but we could have included additional velocity values that we shouldn't have, therefore affecting our acceleration values.
Improving the Investigation- If we could have used a longer ramp that started higher up (so the hangar didn't touch the ground), this would have allowed us to collect more velocity data so we could be more confident about our acceleration values. Instead of only being able to collect data for less than a second, we could have multiple seconds of data to make sure that the pattern we are predicting continues. It also would be better to not have to worry about stopping the cart from crashing and the hangar from hitting the ground because this also limited our data collection, so a lab setup that eliminated these risks would be helpful as well.
